At DT Global, learning and innovation are two of our core values. As a company, we are shaped by our desire to constantly learn from our work and use what we learn to adapt future programming and innovate new ideas. Throughout the month of January, we’re highlighting what Learning and Innovation means here at DT Global, why we believe these two elements are crucial to our work, and how we incorporate them into every aspect of our culture and ethos.
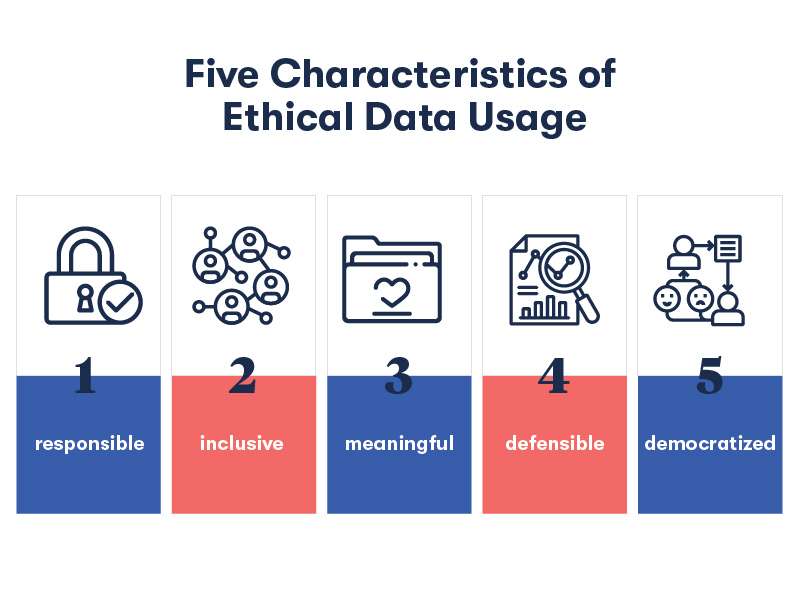
Ethical data collection and use underpin effective learning. In this post Orion Wilcox, a Research Analyst with DT Global’s Learning & Innovation Practice, outlines the five characteristics of ethical data usage in international development and discusses why they matter.
1. Responsible: Broadly speaking, this refers to the concept of balancing open data sharing with the ethical obligation to protect personal information and promote consent. Those of us working in sensitive contexts, such as DT Global’s work in countries such as Afghanistan, Somalia, and Syria, have a unique responsibility to protect privacy and security, as a data breach could realistically lead to violence, discrimination, and exclusionary policies.
In 2019, USAID released a new guide: Considerations for Using Data Responsibly at USAID. The guide outlines the key responsible data challenges faced by development organizations in 2020. These include the competing pressures to openly share data to promote evidence-based approaches, while at the same time protecting personally identifiable information.
2. Inclusive: For development organizations, “inclusive data” means more than simply collecting gender disaggregated metrics. To ensure data is truly inclusive, we need to consider both how we are collecting data (such as the profile of enumerators and the time of day and location of interviews), and what questions we are asking. DT Global’s Gender Integration and Social Inclusion Framework, for instance, includes checklists to help guide staff on these questions. By doing so, we can make sure we understand power dynamics, who is excluded from opportunities, and why. These are not always easy questions to ask. But failing to ask them may say more about us than our beneficiaries.
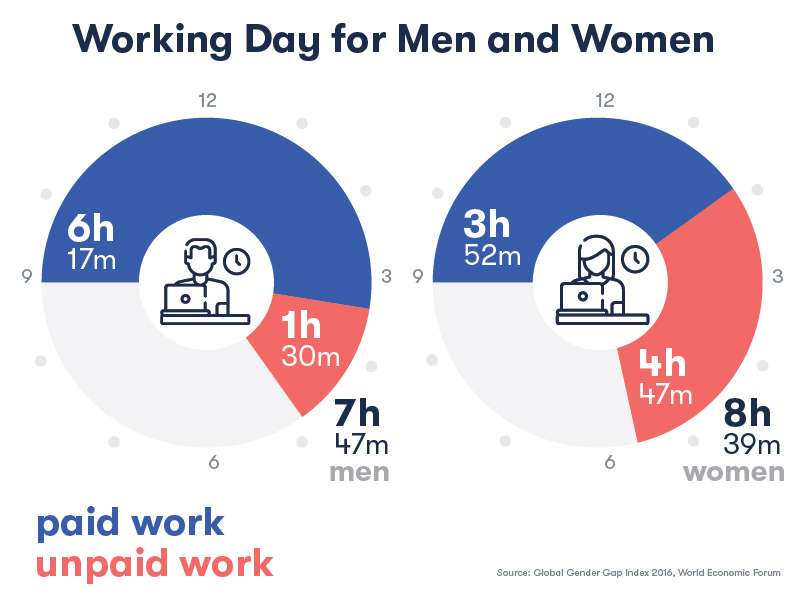
As an old business adage goes, “we measure what matters.” If that’s true, then what we measure is a good indicator of what we think matters. What this indicator reveals has not always been pretty. For example, according to the World Economic Forum, men do around one and half hours of unpaid work per day, compared to four hours for women. Failing to collect data on unpaid work, in turn, severely undercuts our ability to understand why women may struggle to enter the formal workforce.
3. Meaningful: In 2020, the need for better data collection, analysis, and visualization seems like a foregone conclusion. But with all of this collection and visualization, sometimes the point can be lost. In order for data to be meaningful, we need to be explicit about why we want to collect it in the first place, and then make sure that the questions we ask are designed to answer those original questions.
Collecting data on anything and everything only makes it harder to conduct the kind of rigorous analysis that improves programs. In their book The Goldilocks Challenge: Right-Fit Evidence for the Social Sector, Mary Kay Gugerty and Dean Karlan argue that data should respond to one of three needs of any organization: accountability, decision-making, and evaluation. If your data doesn’t fit this bill, you probably don’t need it (and the risks of collecting it may very well outweigh the benefits—see principle #1).
4. Defensible: Data can tell a good story. But is it a true story? For data to be defensible and for programs to benefit from it, the data must be an accurate representation of the real world and stand up to scrutiny. How do we ensure our analysis holds up to scrutiny?
To answer this question, the 80-20 rule is helpful. In most projects, 80 percent of data analysis should be simple (i.e. descriptive statistics and maybe some visualization). Only 20 percent will ever require someone to know the difference between a p-value and an r-squared. Using an 80-20 rule empowers program staff to analyze the program’s progress and impact, which will engender a culture of evidence-based decision-making. For final 20 percent, an organization can bring a data analyst on staff, if needed. Regardless of which approach you pursue, a simple question we ask ourselves at DT Global may help determine if your data is defensible: “If you explained what your data means, would anyone believe you?”
5. Democratized: Democratizing data means making it available and accessible to the communities from which it is pulled—not just implementers and donors. Every year armies of enumerators, notepads and tablets in hand, descend on the developing world to collect data on everything from handwashing to handicrafts. Typically, this data flows up—to implementers and donors—and programs and policies flow down. But is this the best system?
Recognizing that those who are closest to a problem are best able to find solutions, development actors would do well to share data (responsibly) with those they aim to help. While donor initiatives requiring open data—such as the Development Experience Clearinghouse and the Humanitarian Data Exchange—are a step in the right direction, more effort should go toward ensuring data is truly accessible to communities in the global south. These efforts could run the gamut from data literacy training for local government officials to unlocking currently proprietary data for data scientists in Sub-Saharan Africa.